1.6 KiB
background
When some js functions do not work as expected, this article tries to give a debug solution to pinpoint the problem.
Web inspector (DevTools)
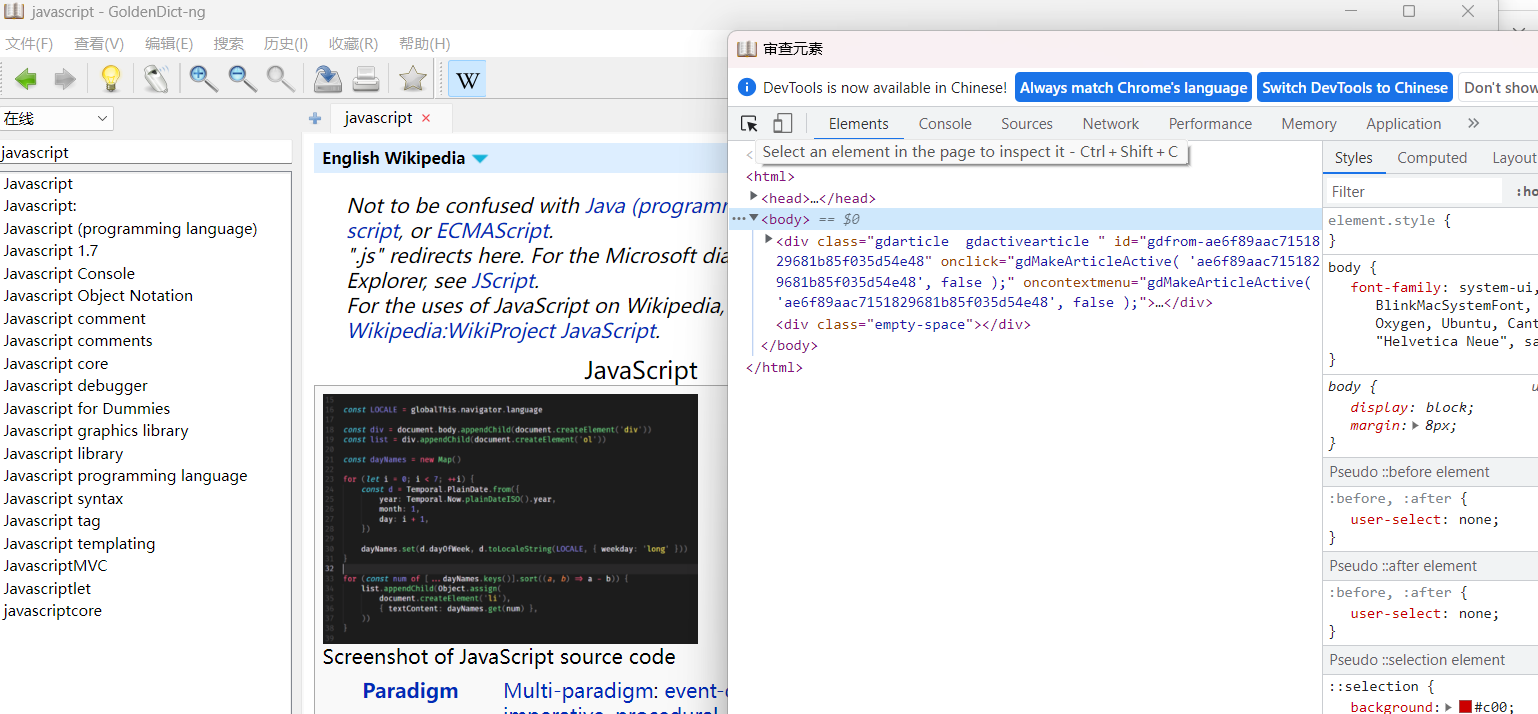
GoldenDict-ng has embedded an inspector, which is actually chromium's DevTools. You can trigger it manually using F12.
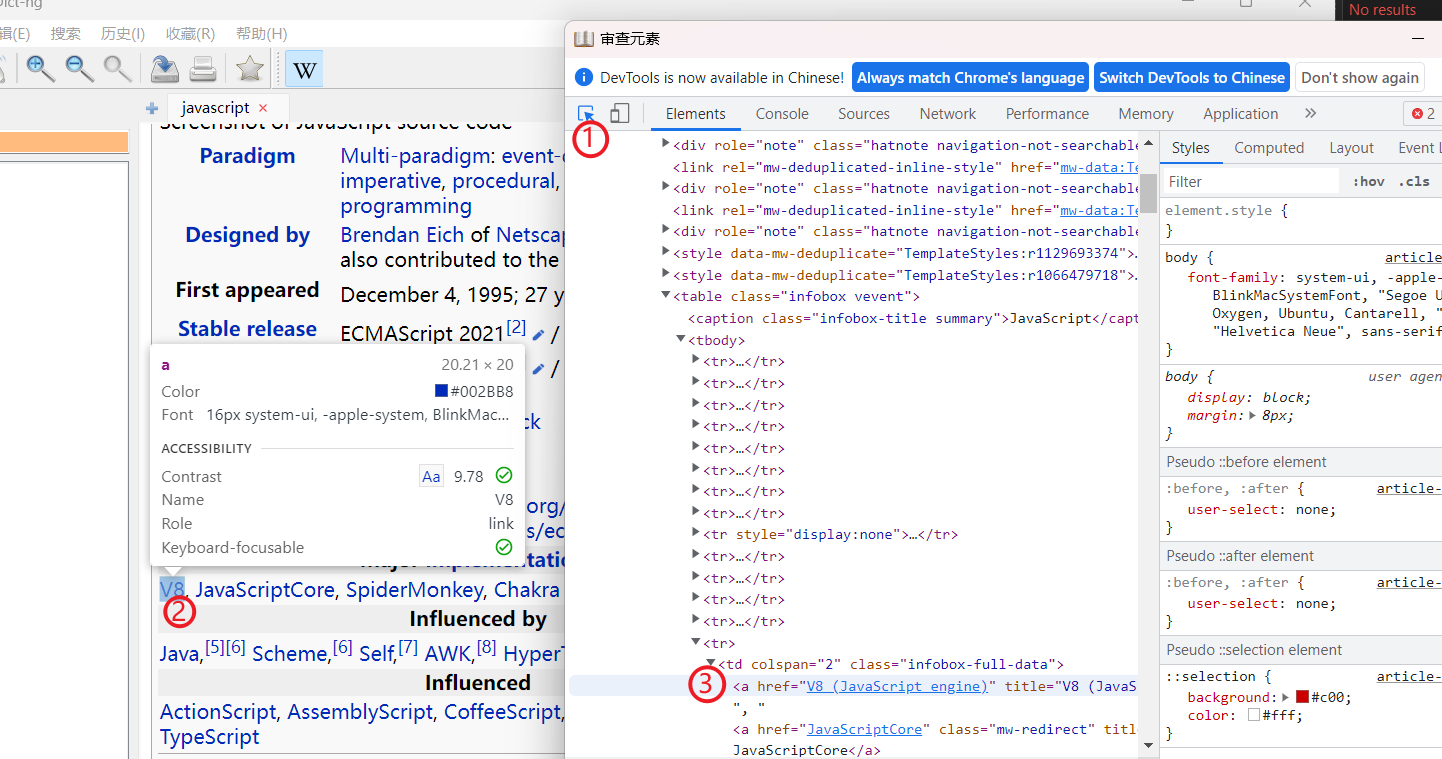
Navigate to the specified element
Click the find element and move mouse to the specified element, click the element will navigate the source panel to the very place.
Modify the css style
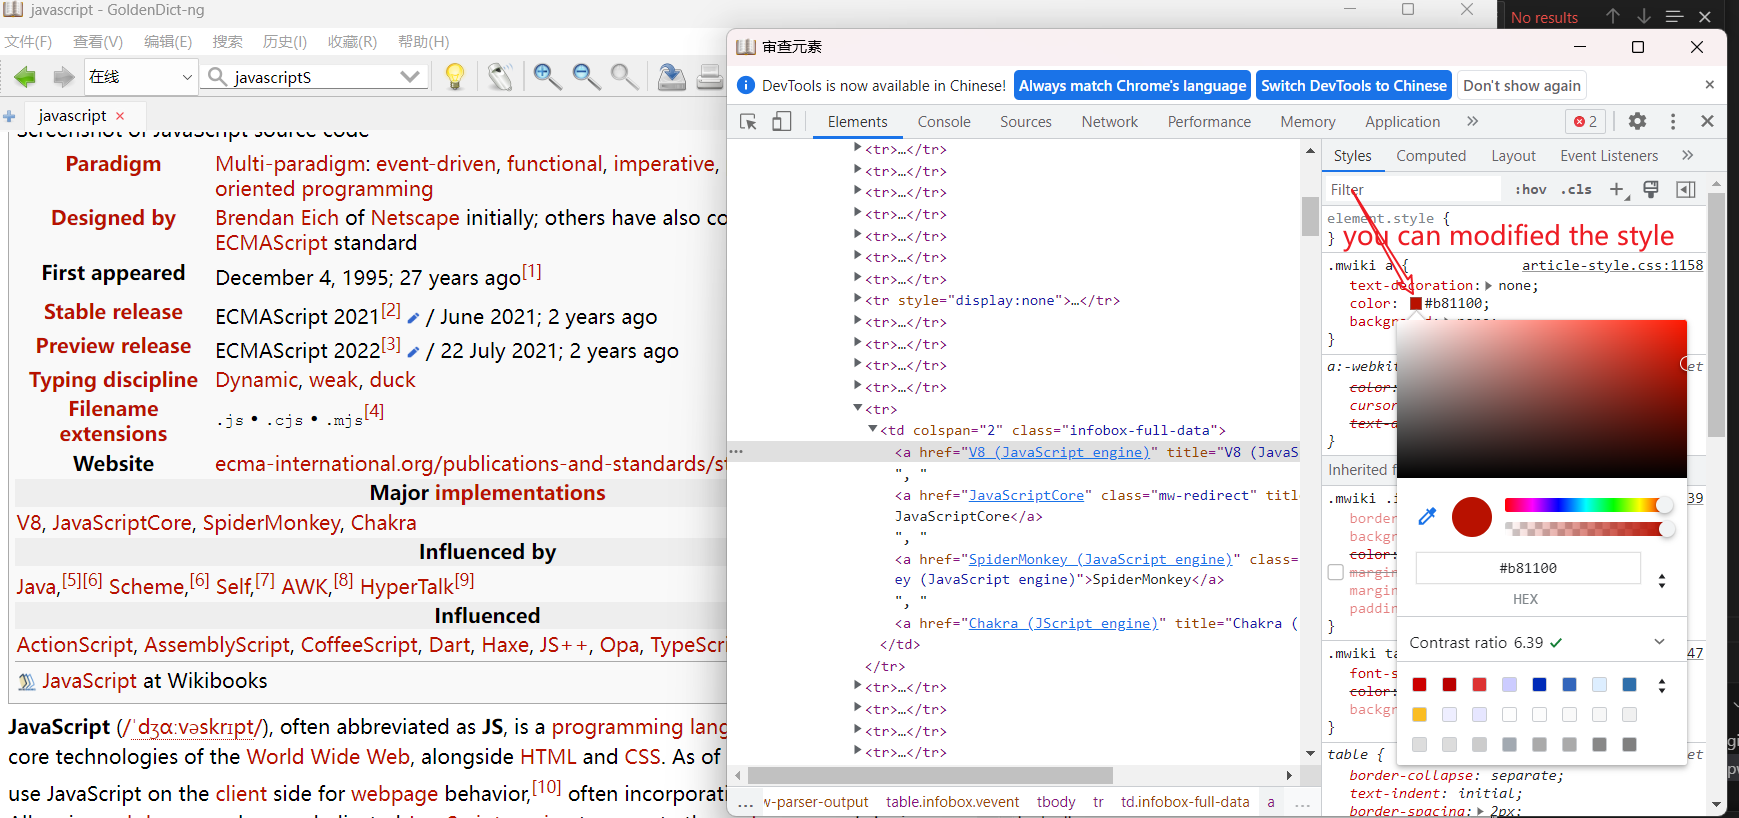
you can play around with the css to modify the appearance of the html and check the results.
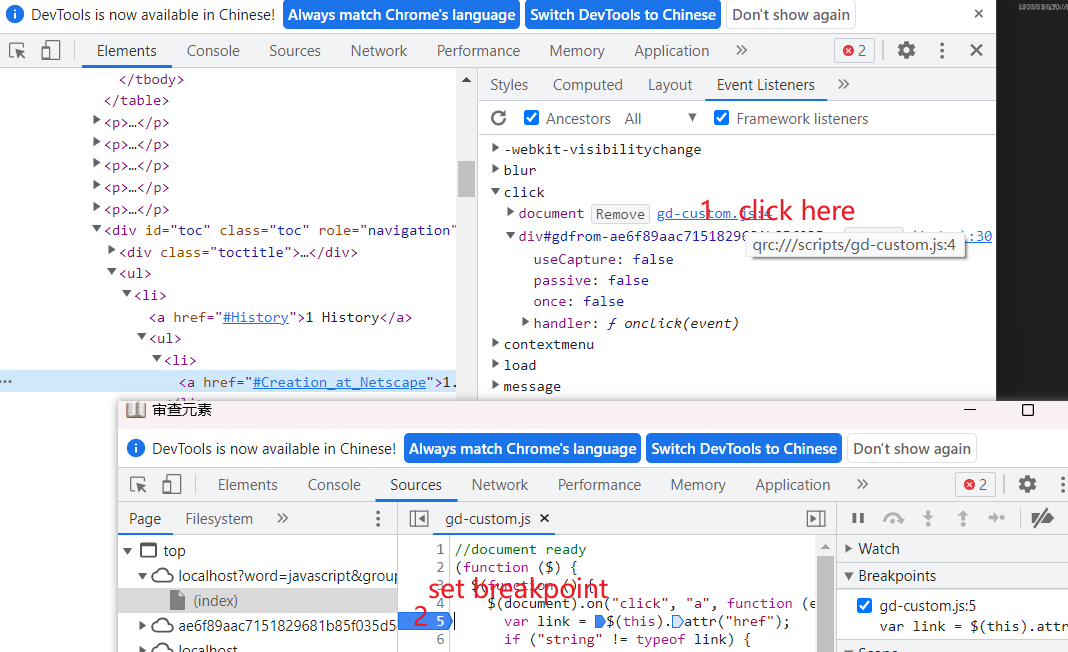
Check javascript events
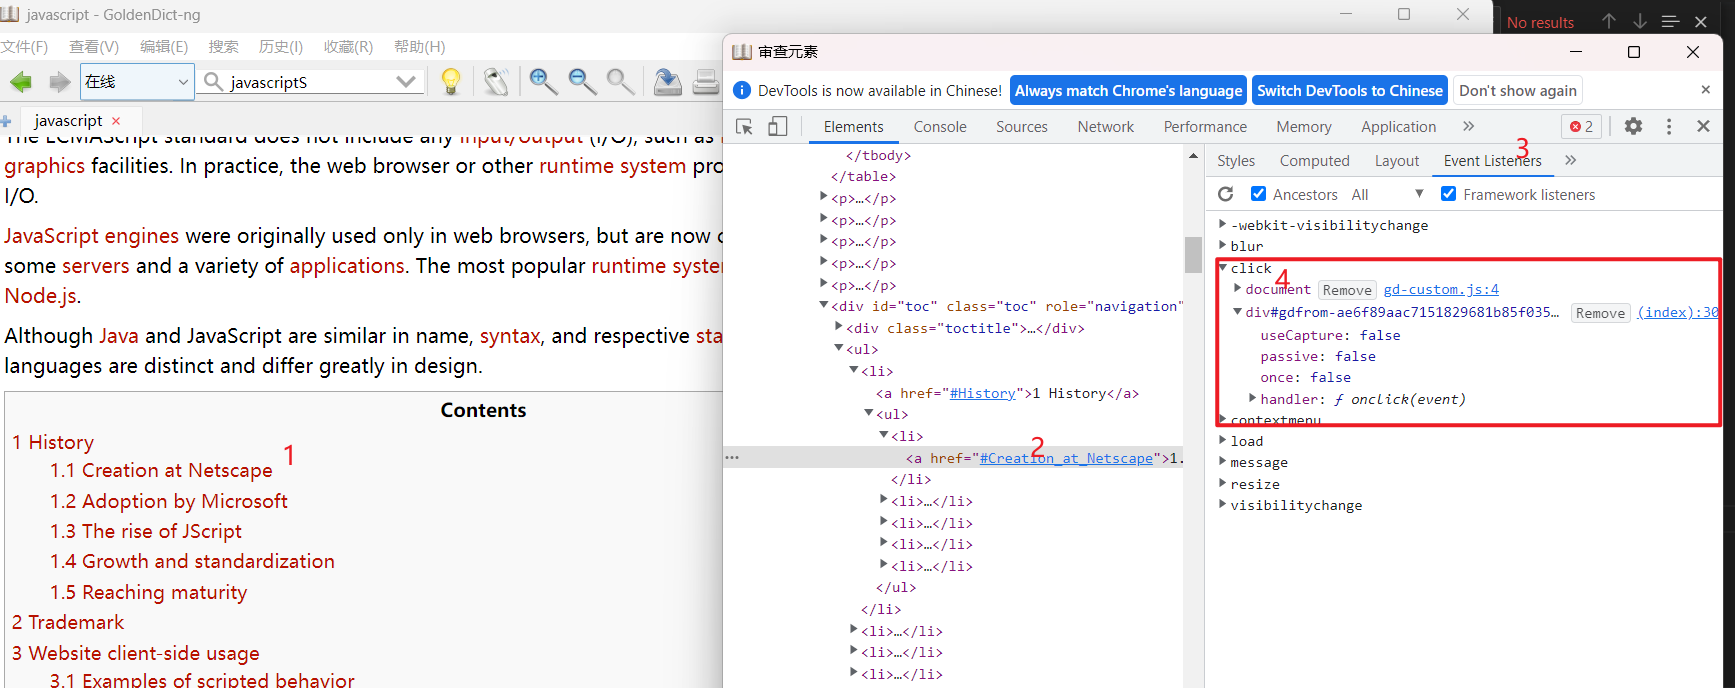
- navigate to the specified element
- check eventlisterner panel
- pay attention to the click events
- in the following screenshot ,there are two registered event listeners, one from the goldendict
gd-custom.jsand one from the html itself. - click the above event listener location will locate to the right place in the javascript.
If some desired event does not triggered , it can first check does the event listeners has been successfully registered. then set a breakpoint in the right place to check whether the event has been triggered and if it can executed successfully.
Reproduce the issues
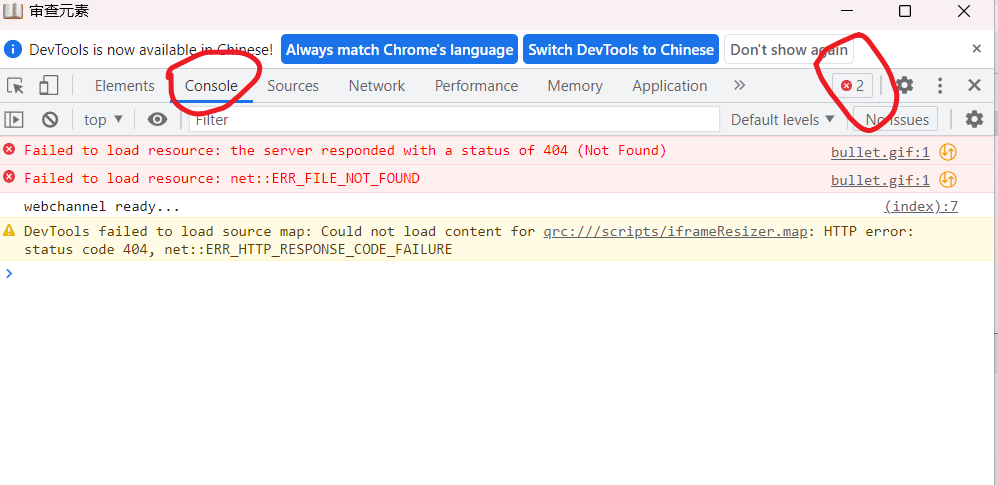
following your normal operations and debugging the javascript code and pay attention to the console output. Whether any errors happened.
